Interactive infographic
007: Every Era
A scroll-driven story of every James Bond film, built as one long interactive graphic.
- My role
- Design, development and research
- Platform
- Web, desktop and mobile
- Status
- Live
- Built with
- Next.js, React, TypeScript, GSAP, D3
007: Every Era is an unofficial, interactive history of the James Bond films, from Dr. No to the arrival of Robert Pattinson. It is a long scroll in thirteen chapters, each one a different way of looking at the same series: the actors, the money, the cars, the gadgets, the villains, the title songs and the places Bond has been. It is a Vizly graphic, built and designed as a single page that works on a phone as well as a desktop.
One series, thirteen ways in
Instead of a list of films, the page treats the series as data and gives each question its own chapter. The story opens on the gun barrel and moves through the origins of the character, the seven actors, a card for each era, and what every film earned.
- 01
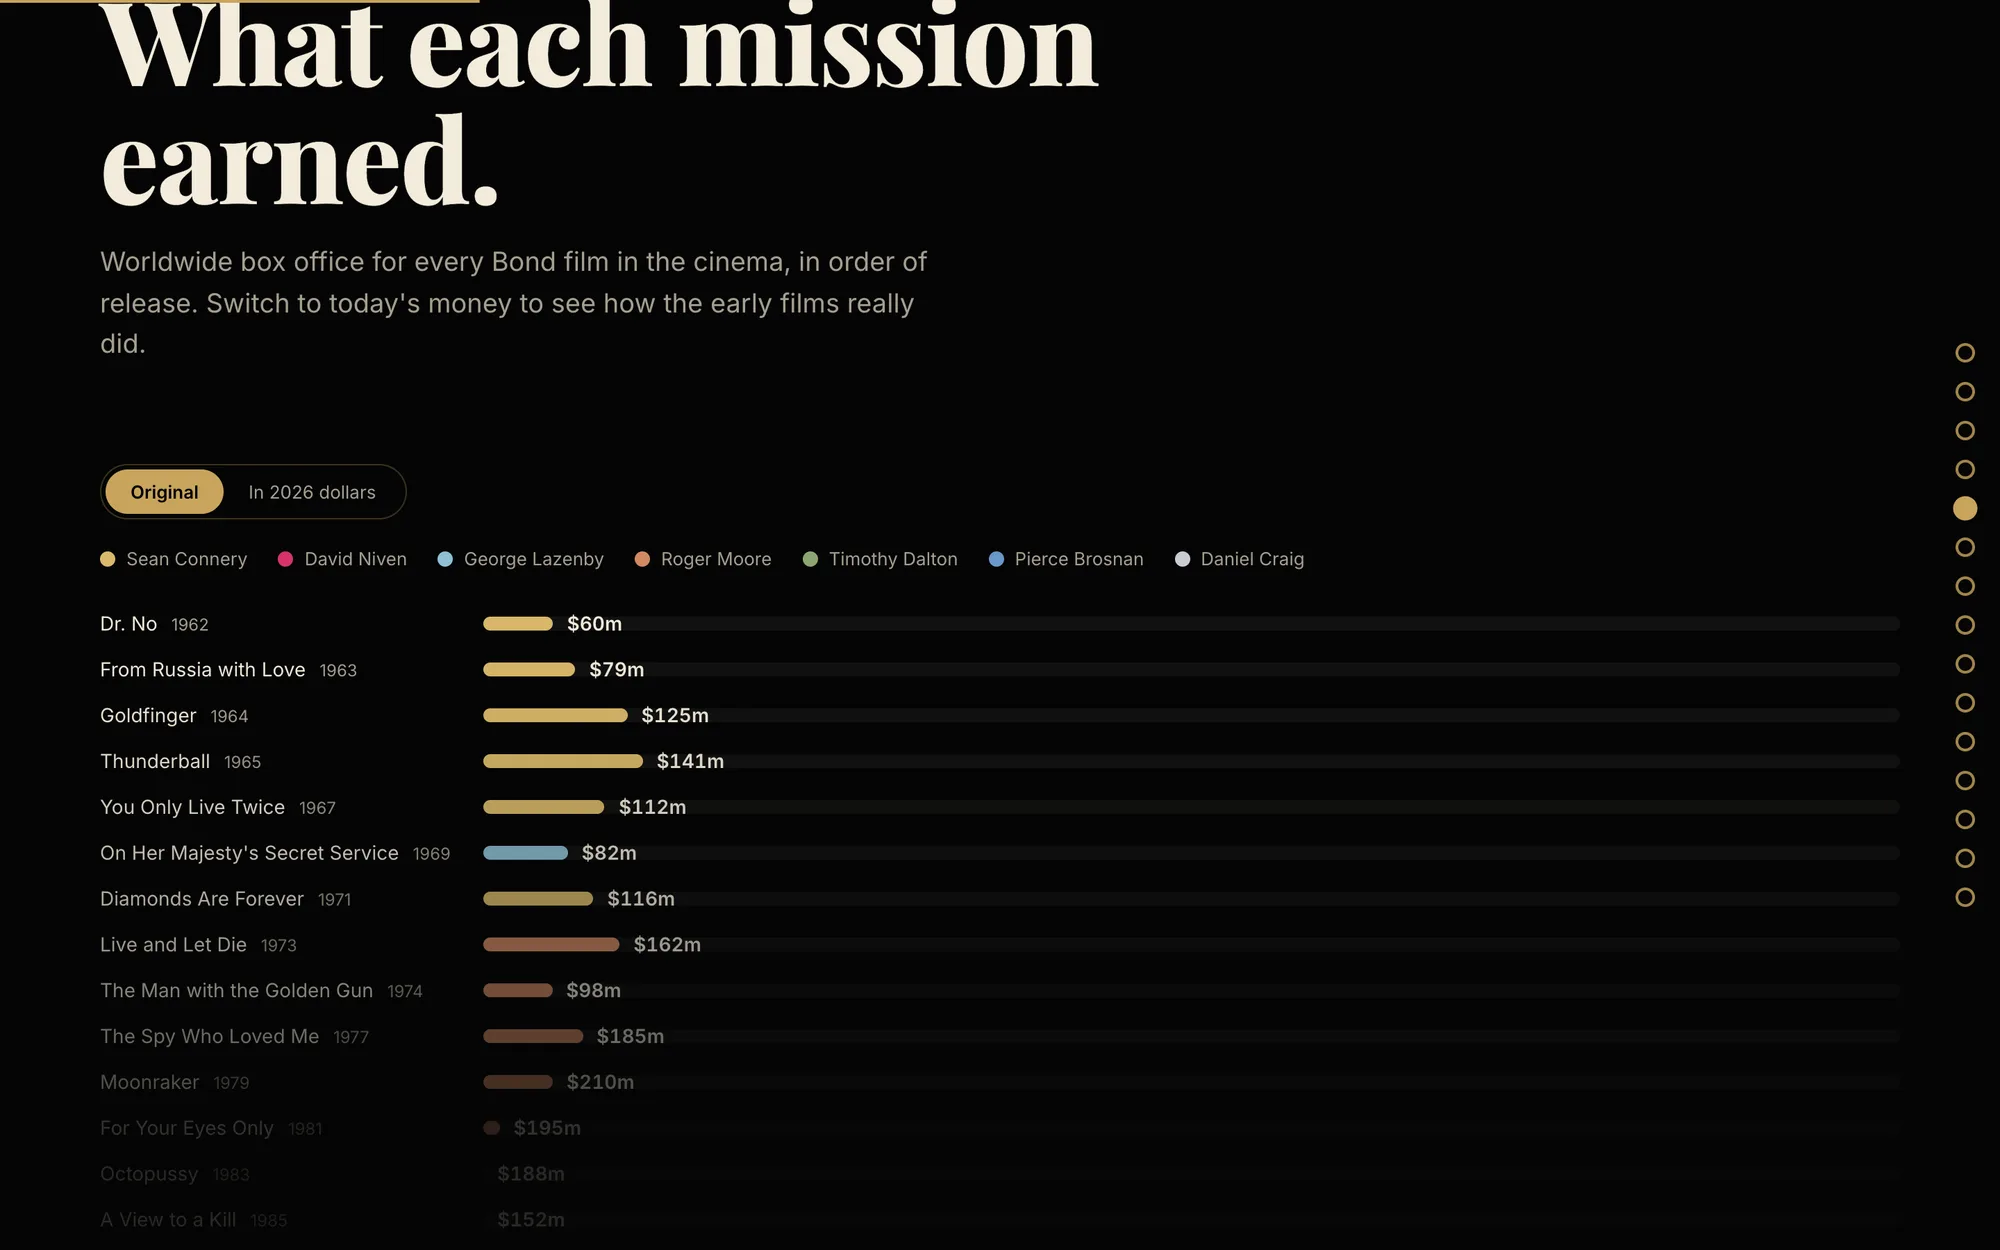
Money, in two currencies
Worldwide box office for every film, with a switch between the original figures and 2026 dollars, so the early films are not unfairly small next to the recent ones.
- 02
Seven faces on a timeline
Every actor who has played Bond, with their films as dots on a timeline, coloured by the studio that made them. Tap a dot to open the film.
- 03
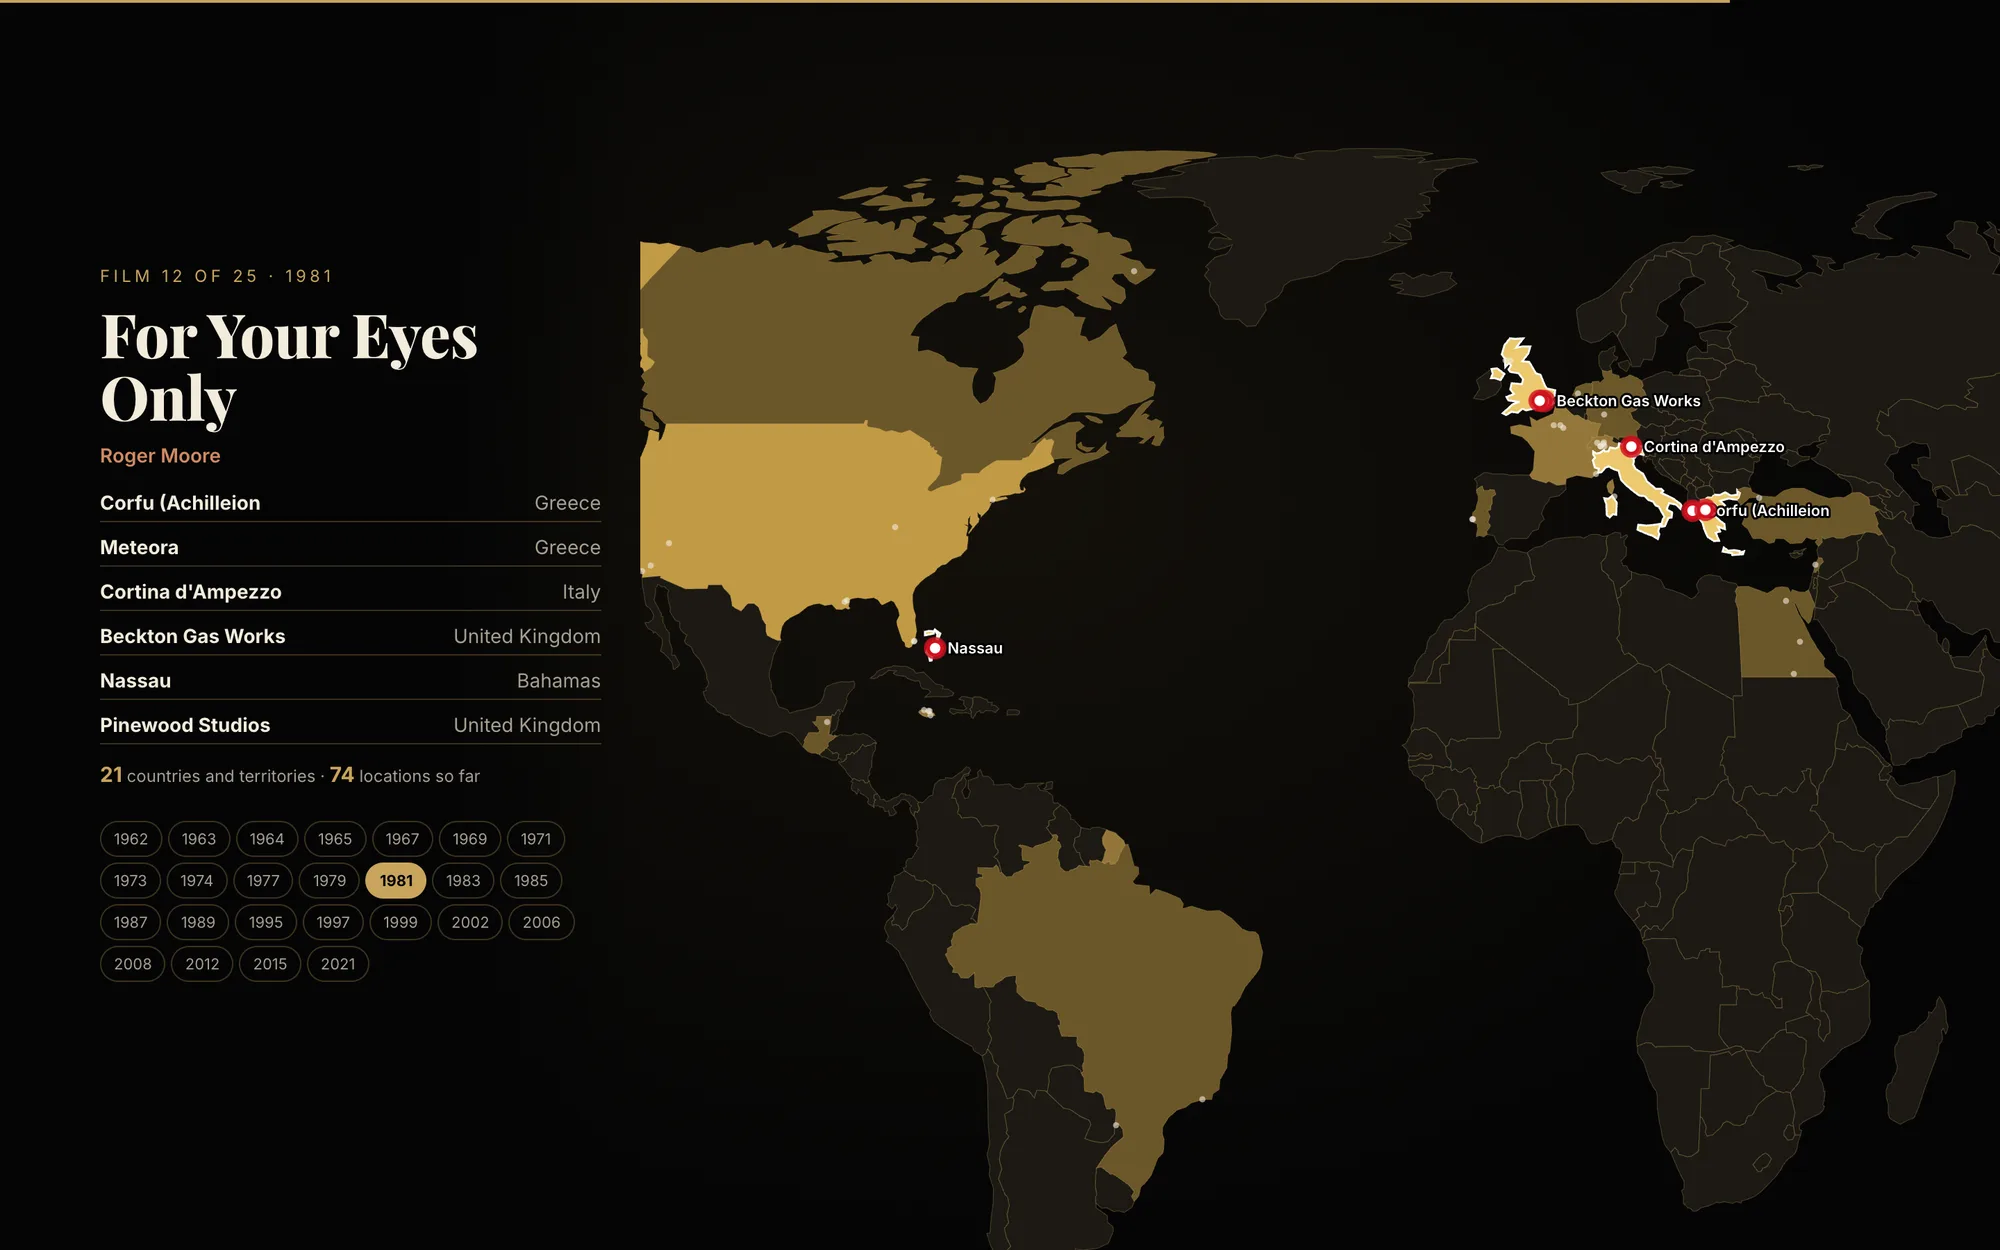
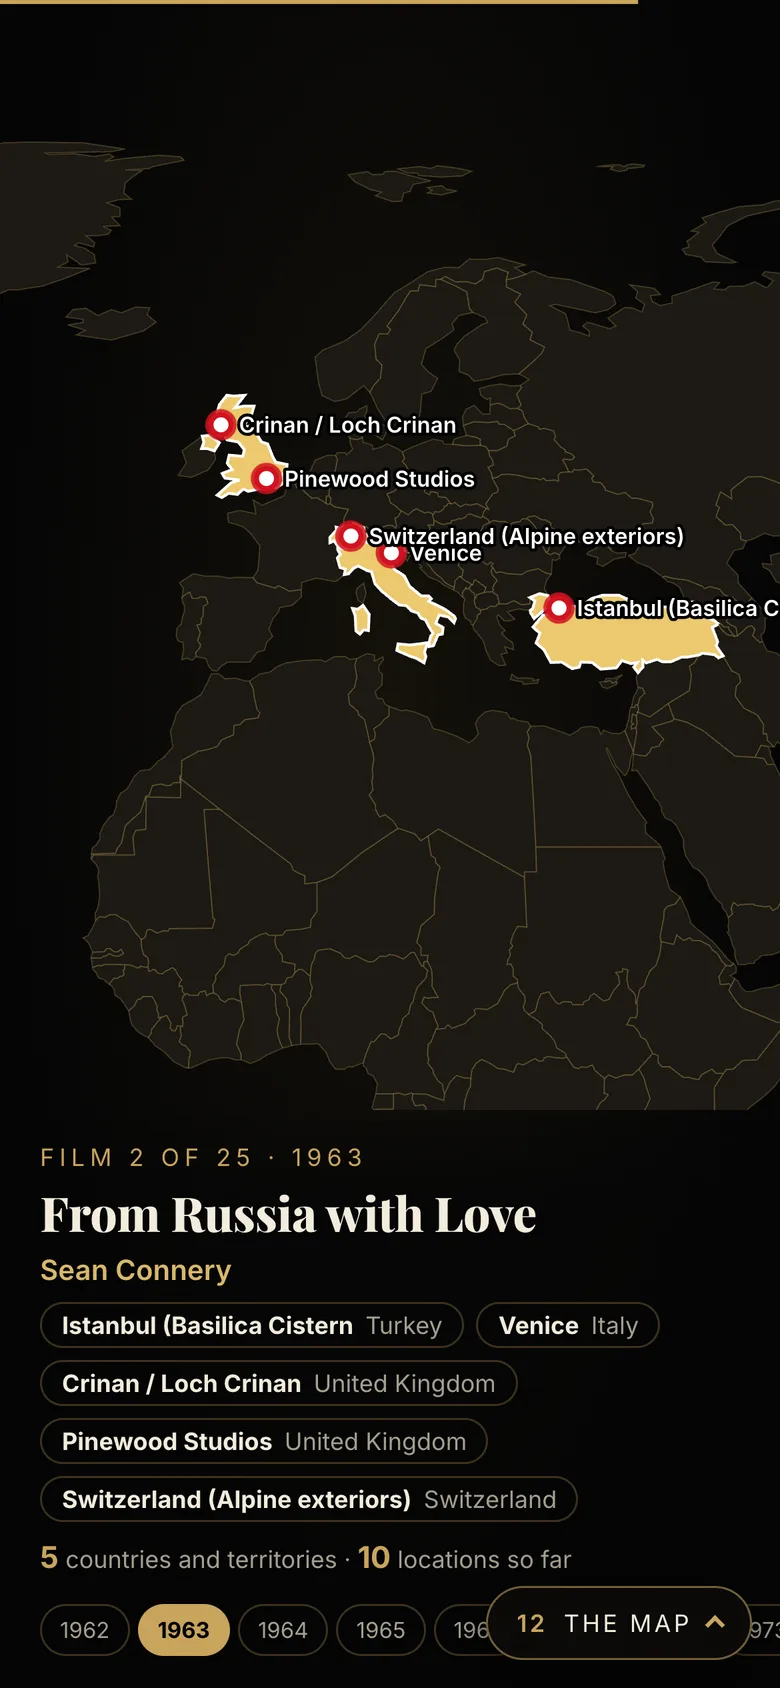
A map that follows the films
Pick a film and the map lights up the countries and locations it shot in, with a running count of how far the series has travelled.
- 04
Cars, gadgets and crew
The Garage, Q Branch and MI6 chapters collect the cars, gadgets and recurring characters, film by film.
- 05
The women, the villains and the sound
Separate chapters for the leading women and the villains, and for the title songs, with a preview you open on tap.
- 06
What comes next
The final chapter covers Bond 26 and the next actor, with the details that have not been announced left marked as classified.
Built to be read on a phone
The page is one Next.js route with the data kept as plain files beside it, and the motion done with GSAP. The charts and the map are drawn by the page itself, so there is no map or chart service to load.
- 01
Checked data
Each film, actor, car, gadget, villain and location is a record with its sources attached, and a script checks that every record cites a source and points at a real film before the page is built.
- 02
Sources in the open
The facts come from public references such as Wikipedia, Box Office Mojo and The Numbers, and the page credits where they came from.
- 03
Made for small screens
On phones the chapters restack to fit the screen, and a floating chapter menu opens a bottom sheet so a reader can jump to any chapter.
- 04
Motion that degrades
Each animated chapter checks for a reduced-motion setting, so the content is there without the animation.
- 05
Made to be shared
A social share image for the page, and a separate teaser card that can be embedded on other sites.
- 06
Clear about what it is
The page says plainly that it is an unofficial infographic and not affiliated with the film studios or the Fleming estate.
Built with
- Next.js
- React
- TypeScript
- GSAP
- D3
- Vercel
Next case study
Productify.ai
Start a project
Got
something
to build?
A site that needs to be better, an app that needs to exist, a platform that has outgrown its tools. Tell me what it is and I’ll tell you honestly how I’d approach it.
hi@rudilouw.com